Overview graph for capture files
Whenever you open a capture file in Omnipeek, an overview graph is displayed at the top of the files window. The overview graph allows you to ‘zoom’ in on a portion of a file by selecting a time range and reprocessing all statistics within the selected time range. The reprocessed statistics are then displayed in the lower half of the files window.
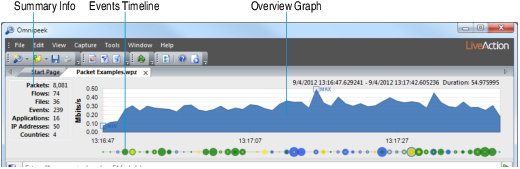
The overview graph is comprised of three parts:
• Overview Graph: The overview graph initially displays data for the entire capture file. When a selection is made by clicking inside the graph and dragging a desired time range, the displayed packets (and the analysis of those packets) are limited to the selected time range. The beginning and end of the selection can be dragged to expand or contract the selection range. Additionally, the selection can be dragged horizontally, moving it while leaving the duration constant.
• Events Timeline: The events timeline is a small line below the overview graph which visualizes the volume and severity of events in the capture file. It represents event counts by size (the larger the dot, the more events in that range), and color (representing the severity of those events). You can right-click inside the overview graph to show or hide the events timeline.
• Summary Info: The summary info located to the left of the overview graph displays the time range and various counts (packets, flows, files, events, applications, IP addresses, countries) in the capture file. When a selection is made in the overview graph, the summary info is updated and displays the counts for the selection, as well as the totals for the entire capture file.
TIP: You can show/hide the Overview graph from the menu: On the menu, click .
Right-click inside the overview graph for the following options:
• Clear Selection: Removes any selected time range from the overview graph and displays data for the entire capture file. You can also clear the selection by pressing the Esc key on your keyboard.
• Network Utilization: Displays the overview graph as network utilization counts.
• Events: Displays the overview graph as event counts.
• Events Timeline: Shows or hides the Events timeline from the display.
• Column: Displays the overview graph as a column graph.
• Skyline: Displays the overview graph as a skyline graph.
• Area: Displays the overview graph as an area graph.
• Line: Area: Displays the overview graph as an line graph.
• Line/Points: Displays the overview graph as an line/points graph.
• Linear: Displays the overview graph as a linear display.
• Logarithmic: Displays the overview graph as a logarithmic display.
• Show Min/Max: Displays the minimum and maximum values of overview graph.
• Synchronize Events: Updates the overview graph based on the current set of events in the Events view.